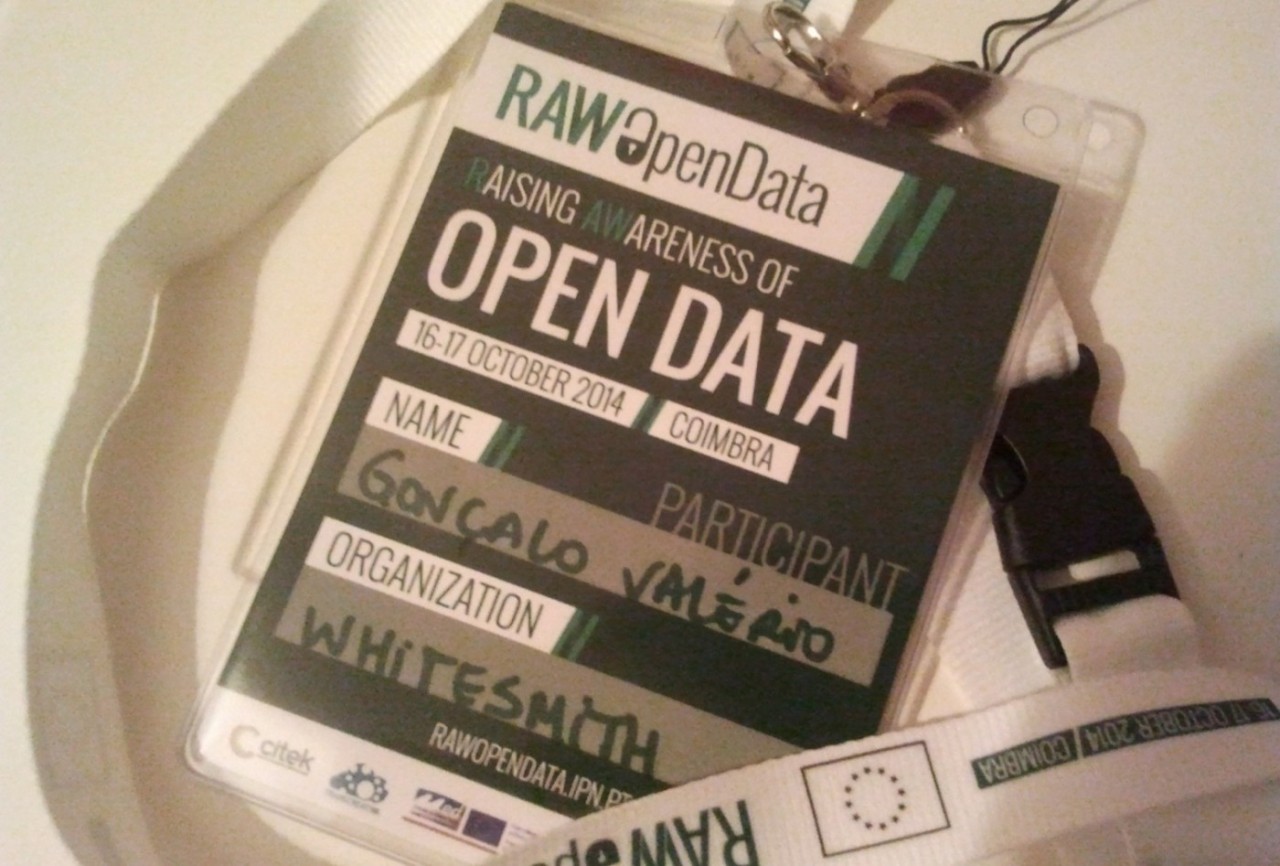
Last month I attended an interesting event here in Coimbra, about the concept of Open Data, which is described in Wikipedia like this:
Open data is the idea that certain data should be freely available to everyone to use and republish as they wish, without restrictions from copyright, patents or other mechanisms of control.
During the event several topics were discussed around this issue, but the ones that caught my attention were focused on the European directives about this subject, the Portuguese case (our government approach on this issue), licenses that should be used on this kind of content and data visualizations.
The major arguments used to incite companies, public entities and essentially governments to release their data in an open format, so it can be used by the general public and other entities were:
- it fosters innovation
- gives the ability to improve existing products and services
- increases the transparency of the organization
- raises the quality of the citizen’s participation in a democracy
In the morning Cristiana Sappa, argued that all this data should have a license that gives permission to the users to reuse it for both commercial and non-commercial purposes, allows the creation of derivative works and doesn’t have any “Share alike” condition. One good example is Creative Commons Zero (CC0).
In the afternoon, the Portuguese case was presented, where several initiatives were explained like Dados.gov, Portal de Transparência Municipal and Portal do Software Público. Despite all the effort, at the end of this talk i was left with the impression that there is still much to be done and that the quantity and quality of the released data is not there yet.
The day ended with a talk given by Paolo Ciuccarelli about data visualizations. In this talk he defended the need to turn the raw data into something that people could perceive what was being shown to them and reason about it. He then gave many excellent examples of amazing work that he and his team had done in the past. I would like to leave one reference to a tool, called RAW, that was presented which, helps the common user in the creation of nice visualizations for his data. You should check it out.
Concluding this post, i would like to leave here some useful links that were shared during the event and where interesting public data is published. Here they are:
